Cloud price history
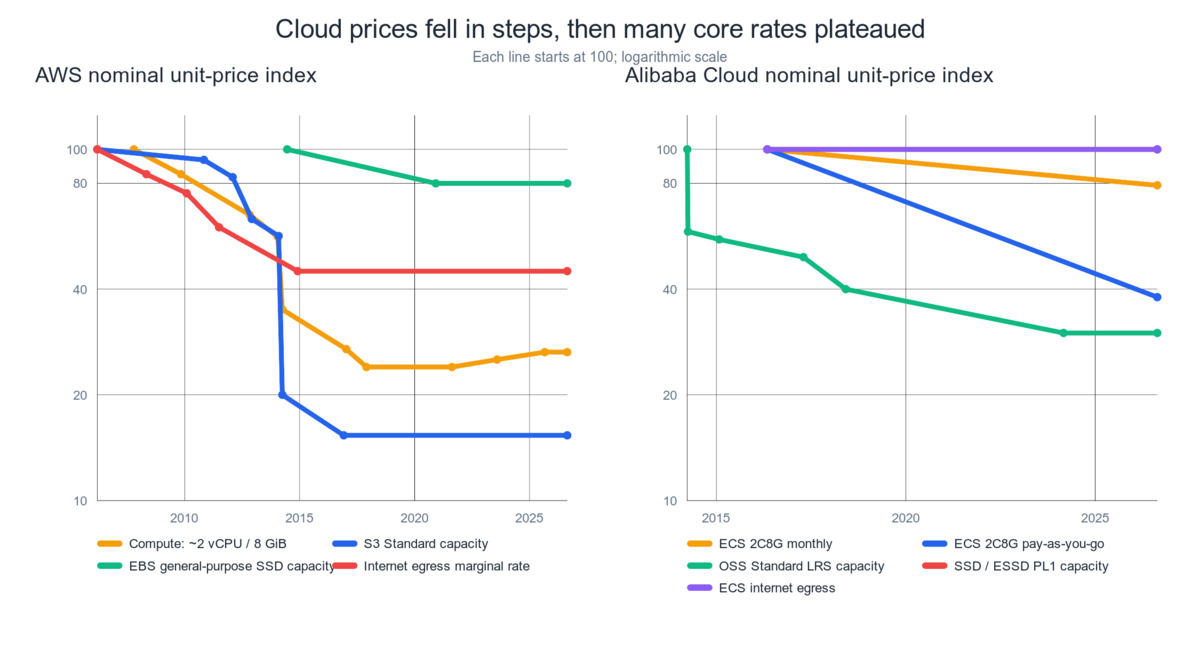
Observation windows differ by series. The common current endpoint is the 2026-08-22 snapshot. Implied half-life describes the observed interval; it is not a forecast.
Direct answer
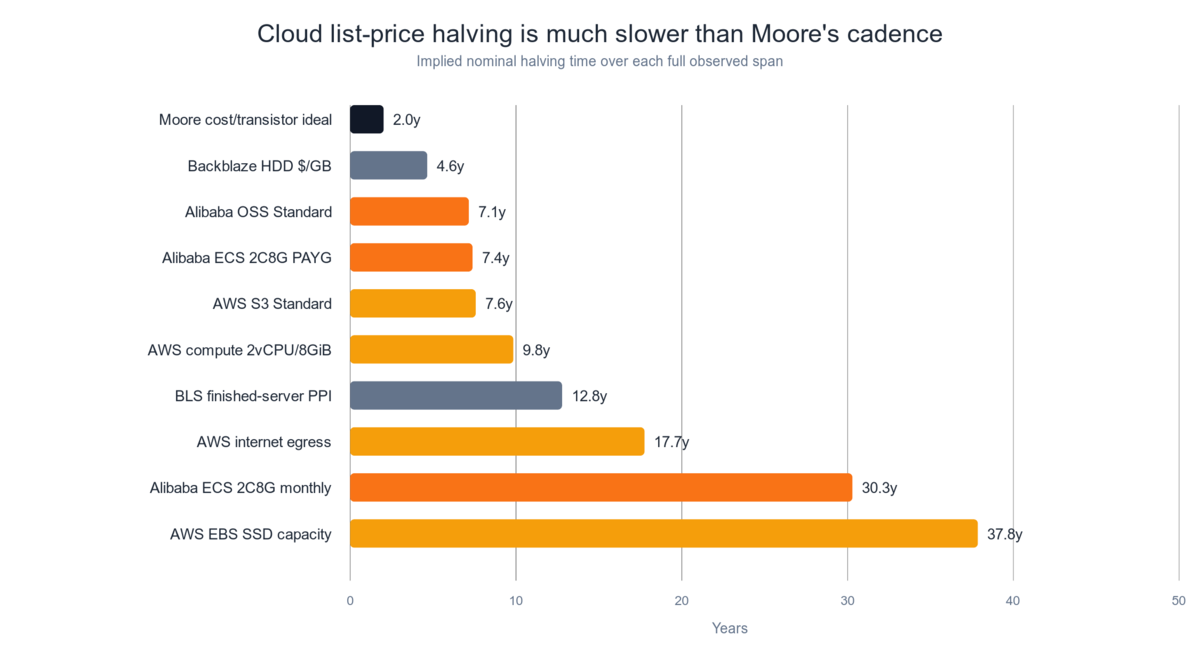
Cloud prices fell substantially, but they did not follow a stable “halve every two years” path. Early competition produced large step changes; mature core meters often plateaued. Recent gains are more likely to require moving to a new instance generation, architecture, storage class, or commitment model than waiting for an old SKU to become cheaper automatically.
What actually halved—and how slowly
| Series | Observed span | Start → end | Nominal change | Implied half-life |
|---|---|---|---|---|
| AWS ~2 vCPU / 8 GiB compute | 2007–2026 | $0.400 → $0.10584/h |
-73.5% |
9.8 years |
| AWS S3 Standard capacity | 2006–2026 | $0.150 → $0.023/GB-month |
-84.7% |
7.6 years |
| AWS general-purpose SSD capacity | 2014–2026 | $0.100 → $0.080/GB-month |
-20.0% |
37.8 years |
| AWS internet-egress marginal rate | 2006–2026 | $0.200 → $0.090/GB |
-55.0% |
17.7 years |
| Alibaba ECS 2C8G monthly | 2016–2026 | ¥302 → ¥238.60/month |
-21.0% |
30.3 years |
| Alibaba ECS 2C8G PAYG | 2016–2026 | ¥1.31 → ¥0.4971/h |
-62.1% |
7.4 years |
| Alibaba OSS Standard public effective rate | 2014–2026 | ¥0.300 → ¥0.090/GB-month |
-70.0% |
7.1 years |
| Alibaba SSD / ESSD PL1 capacity | 2016–2026 | ¥1.00 → ¥1.00/GB-month |
0% |
none |
| Alibaba ECS internet egress | 2016–2026 | ¥0.80 → ¥0.80/GB |
0% |
none |
The values come from
long_run_metrics.csv.
Inflation-adjusted figures are published separately; they do not correct for
cross-generation performance.
Four different histories
Compute: price cuts became migration work
AWS same-advertised-capacity compute fell rapidly through 2017, then roughly
plateaued: m4.large was $0.108/h, m5.large and m6i.large $0.096,
m7i.large $0.1008, and m8i.large $0.10584. Price-performance improved,
but realizing it required moving generation and validating the workload.
Alibaba’s monthly and PAYG curves diverged. A 2C8G monthly shape fell only 21%
from 2016 to 2026, while PAYG fell 62.1%. Much of the latter was a narrowing of
the elasticity premium: a full PAYG month went from 3.17× monthly to 1.52×.
Object storage: closest to hardware—then a ten-year plateau
S3 Standard’s first tier fell from $0.15 in 2006 to $0.023 in 2016, then
stayed nominally flat through the snapshot. Alibaba OSS Standard moved from
¥0.30 in 2014 to a ¥0.12 directory rate; a durable public effective rate of
¥0.09 appeared in 2024. The large early fall did not remove request,
retrieval, minimum-duration, or egress meters.
Block storage: capacity plateau, performance-density gain
EBS gp2 to gp3 reduced capacity price only 20%. For a 200 GiB volume, however,
baseline IOPS rose from 600 to 3,000, so price per baseline IOPS fell 84%.
Alibaba’s 2016 SSD and 2026 ESSD PL1 both anchor at ¥1/GB-month; product
semantics and performance changed even though the capacity meter did not.
Egress: the least silicon-like meter
AWS first-paid-tier egress reached $0.09/GB in 2014 and then remained flat;
the 2021 free allowance improved small-account average cost but not large-volume
marginal cost. Alibaba ECS Hangzhou egress stayed at ¥0.8/GB across the
2016–2026 anchors. Path engineering—CDN, private connectivity, caching,
regional placement, or self-hosted transit—matters more than waiting.
Full bills move slower than headline compute
The capacity basket is approximately 2 vCPU / 8 GiB compute + 200 GB/GiB general block storage + 1 TiB monthly internet egress, plus current AWS public IPv4. It is a capacity comparison, not a performance or SLA comparison.
| Basket | Start | End | Change | Implied half-life |
|---|---|---|---|---|
| AWS 2008 → 2026 | $486.08/month |
$180.07/month |
-63.0% |
12.6 years |
| Alibaba monthly 2016 → 2026 | ¥1,321.20/month |
¥1,257.80/month |
-4.8% |
141.0 years |
| Alibaba PAYG 2016 → 2026 | ¥1,979.90/month |
¥1,488.68/month |
-24.8% |
24.3 years |
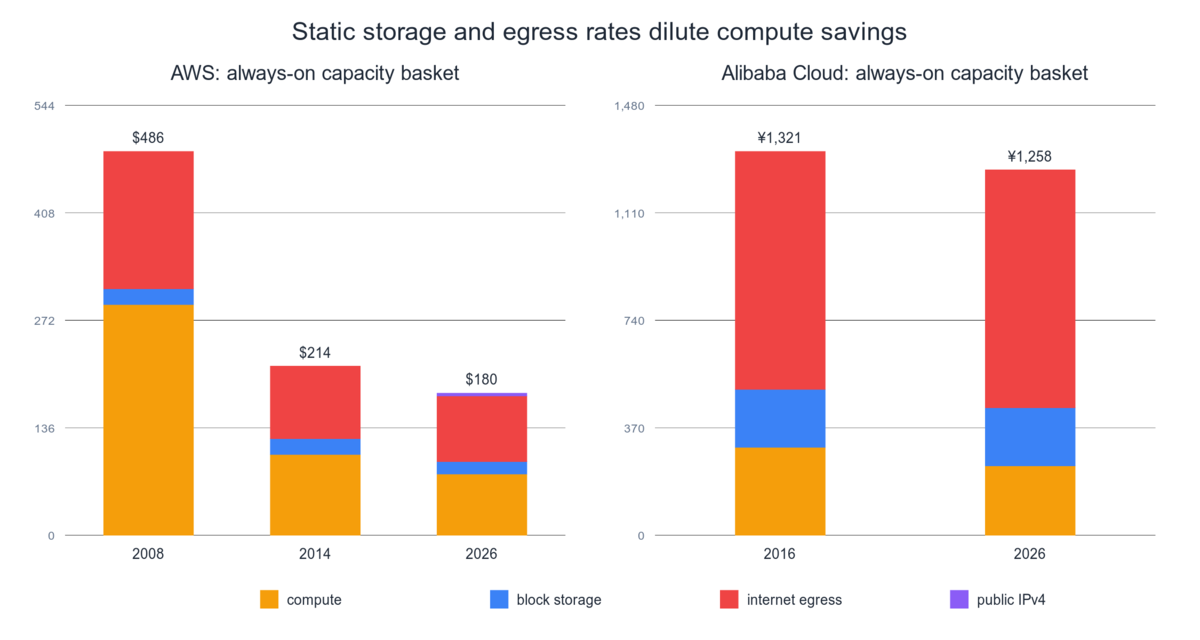
In the 2026 AWS basket, egress is 46.2% of the bill—larger than compute at 42.9%. In the Alibaba monthly basket, unchanged egress is 65.1%. A workload’s bill weights decide whether a new compute generation matters.
Budgeting and FinOps implications
- Do not budget automatic 10–20% annual list-price cuts for mature core SKUs.
- Benchmark new generations every two to three years; migrate first, commit second.
- Keep separate budgets for compute, storage capacity, storage performance, object activity, and network paths.
- Preserve public price as the contract anchor, but plan using invoice-level effective rates and commitment waste.
- Model high-egress workloads independently; their economics are not governed by the compute curve.
- For self-hosting, hardware also arrives in steps. New server purchases capture technology gains only at refresh time, while facilities, power, and network set a floor.
Boundaries
- Public price is not enterprise net price.
- Same-advertised-capacity generations are not performance-equivalent.
- S3, OSS, EBS, ESSD, and self-hosted systems differ in durability, latency, topology, and operations.
- Alibaba’s exact long-run compute series starts in 2016 because earlier full SKU tables could not be reconstructed reliably.
- The endpoint may change after 2026-08-22; refresh before purchase.