This is the multi-page printable view of this section. .
Cloud Cost Ledger
-
1: Model contract
-
2: Compute: EC2, ECS, and owned servers
-
3: Block storage: EBS and ESSD
-
4: Object storage: S3, OSS, and owned topology
-
5: Egress and network paths
-
6: Managed-service markup
-
7: Cloud price history
-
8: Dataset releases
Cloud bills are not one price. They are a stack of resource meters, topology, activity, time commitments, and commercial terms. The ledger makes that stack visible and then asks where the money actually goes.
Price snapshot: 2026-08-22 · Research completed: 2026-08-24 ·
Primary regions: AWS us-east-1, Alibaba Cloud cn-hangzhou ·
FX: 1 USD = 6.7817 CNY · Month: 730 hours. All amounts below are
dated public-price or scenario values, not live quotes or enterprise net prices.
The bill in one formula
The denominator matters just as much:
A 50% commitment used at only 60% coverage has an effective price of
0.50 / 0.60 = 83.3% of on-demand—not 50%. Discounts can lower the invoice
while raising stranded-value and exit risk.
Six findings that survive the details
| Finding | Audited number | What it establishes | What it does not establish |
|---|---|---|---|
| Compute scales linearly inside a family | AWS c7i/m7i/r7i same-vCPU price factors are about 0.885 / 1 / 1.313; Alibaba c9i/g9i/r9i about 0.779 / 1 / 1.330 |
Larger shapes do not automatically buy cheaper cores | Equal vCPU labels mean equal workload performance |
| Elasticity has a visible premium | Alibaba g9i.large PAYG at 730 hours is 1.521× its monthly price; time-only crossing is 65.8% utilization |
PAYG and monthly are different risk products | Monthly is always cheaper after workload and commitment risk |
| Block-storage rankings flip with performance | 200 GiB baseline: gp3 ¥108.51, AutoPL ¥200; at 11.8K IOPS / 220 MiB/s: gp3 ¥432.67, AutoPL ¥200 |
Capacity-only comparisons can reverse the answer | Either service is performance-equivalent for every instance or latency profile |
| Object capacity rates have converged | S3 Standard ¥0.156/GB-month; OSS Standard LRS ¥0.120 |
Capacity alone is no longer the whole bill | Requests, retrieval, minimum duration, small objects, or egress are equivalent |
| Reliable topology sets the self-host threshold | Versus OSS one-year package: 8-node single site 199 TB; dual site 536 TB; three-site durable crossing 1,223 TB |
Object-storage break-even is a topology question | A single-site pool equals S3’s service level |
| Mature bills decline slower than compute | AWS capacity basket 2008→2026: -63.0%; Alibaba monthly basket 2016→2026: -4.8% |
Flat storage/egress meters dilute compute gains | The two baskets are performance- or SLA-equivalent |
Three bill surfaces
Compute: price the useful core
Instance size mostly changes the number of objects you operate, not the price per vCPU inside a family. Architecture, memory ratio, region, generation, and purchase term change it materially. The compute ledger publishes current reference shapes, regional factors, commitment crossings, and the discrete self-hosted scale curve.
Block storage: price capacity and performance together
For gp3, capacity, IOPS, and throughput are separate meters. For ESSD AutoPL, capacity carries a rising baseline and performance can add further meters. The block-storage ledger shows the same three scenarios at equal capacity and requested performance, plus the instance-channel ceiling that can make paid IOPS unusable.
Object storage: price activity and exit, not just TB
The object bill is storage class + billable object size + minimum duration +
requests + retrieval + replication + transfer. The object-storage ledger
adds the self-hosted minimum reliable topology, so 100 TB, 500 TB, and
1 PB are not treated as the same engineering problem.
The long-run insight
Cloud prices fell quickly in early competition, then many core marginal rates
plateaued. AWS S3 Standard has stayed at $0.023/GB-month since 2016; AWS
internet egress at $0.09/GB since 2014; Alibaba ESSD PL1 capacity at
¥1/GiB-month and ECS egress at ¥0.8/GB across the report’s 2016–2026
anchors. Compute kept improving, but users usually had to migrate generation,
architecture, or purchase model to capture it.
Read Cloud price history for the full index and bill baskets.
Decision rule
- Build a 90–180 day workload fingerprint: hourly compute, capacity, IOPS, throughput, object sizes, requests, retrieval, and every network path.
- Separate stable floor, predictable peak, interruptible work, and stateful data.
- Match topology and useful performance before comparing prices.
- Price commitment utilization and stranded value, not the advertised discount.
- Compare public price, actual invoice, and self-hosted procurement as three separate layers.
- Use a break-even point as permission to start engineering evaluation—not as an automatic migration order.
Released data
| Dataset | Coverage | Source window | Status |
|---|---|---|---|
Cloud build-versus-buy modelbuild-vs-buy-2026
|
Compute, PostgreSQL RDS-like services, object storage, egress, break-even points, and sensitivity. | 2026-08-22—2026-08-24 | released-snapshot |
AWS and Alibaba Cloud pricing modelcloud-pricing-2026
|
EC2/ECS, RDS, block storage, object storage, traffic, commitments, and time value. | 2026-08-22—2026-08-24 | released-snapshot |
Cloud price-history modelcloud-price-history-2026
|
Long-run compute, storage, and egress price anchors with physical-input and inflation context. | 2006—2026; reviewed 2026-08-24 | released-snapshot |
“Released snapshot” means the files ship with the site together with sources, methodology, schema, and checksums. It is still not a live provider quote.
Each release contains the full report, source ledger, CSV/JSON tables, methodology, schema summary, and SHA-256 checksums. The highlighted pages link directly to their exact source tables.
1 - Model contract
Model outputs are released as dated snapshots. They remain scenarios, not live quotes.
Two cost functions
The comparison period , currency date, tax treatment, financing cost, and residual value must be explicit. Cash cost and economic cost are shown separately rather than blended.
Like-for-like rule
Match usable capacity, required availability, durability, backup, recovery objective, operations coverage, security controls, region, and demand shape. When parity cannot be established, publish two bounded scenarios rather than one false-precision ratio.
Required outputs
- Monthly and cumulative cost curves.
- Break-even scale and break-even time.
- Sensitivity to utilization, hardware life, labor, power, financing, and growth.
- Cash, economic, and exit-cost views.
- Applicability boundaries and omitted costs.
The claim is never “self-hosting is X times cheaper” without the workload and assumptions that make true.
2 - Compute: EC2, ECS, and owned servers
Snapshot: 2026-08-22 · AWS us-east-1 prices exclude applicable tax ·
Alibaba Cloud cn-hangzhou public prices include China-site tax ·
1 USD = 6.7817 CNY, 730 hours/month. Prices are not performance benchmarks.
Direct answer
Inside a mainstream instance family, price is almost linear in vCPU. Buying a larger shape reduces instance count, not unit-core price. The variables that move unit cost are memory ratio, CPU architecture, generation, region, purchase term, and—most importantly—useful utilization.
For stable owned compute, the material-cost curve falls rapidly while the first server fills, jumps when active and spare servers are added, then flattens. The economic question is not “how large is the company?” but “can this workload keep the minimum reliable pool usefully full for the asset life?”
Current 2C8G reference shapes
| Offer | Billing | Native price | 730-hour month | CNY / vCPU-month |
|---|---|---|---|---|
AWS m8i.large, 2C8G |
On-demand | $0.10584/h |
$77.26 |
¥261.99 |
Alibaba g9i.large, 2C8G |
Monthly | — | ¥238.60 |
¥119.30 |
Alibaba g9i.large, 2C8G |
PAYG | ¥0.4971/h |
¥362.88 |
¥181.44 |
The raw cash-price ratio is not a procurement conclusion. m8i and g9i differ
in CPU, network, storage channel, regional context, tax, and business
performance. Normalize with application TPS, latency, compile throughput, or
another useful output before choosing.
The family skeleton
Same-vCPU prices reveal a repeatable memory-ratio structure:
| Family | Shape | Monthly reference | Relative to general purpose |
|---|---|---|---|
AWS c7i.large |
2C4G | $65.15 |
0.885 |
AWS m7i.large |
2C8G | $73.58 |
1.000 |
AWS r7i.large |
2C16G | $96.58 |
1.313 |
Alibaba c9i.large |
2C4G | ¥185.91 |
0.779 |
Alibaba g9i.large |
2C8G | ¥238.60 |
1.000 |
Alibaba r9i.large |
2C16G | ¥317.48 |
1.330 |
Moving from large to xlarge or 2xlarge inside the same family remains
nearly linear. Exceptions—burstable CPU, local disks, dedicated hosts, bare
metal, GPUs, NUMA, and commercial licenses—carry separate fixed or step meters.
Architecture, generation, and region
The snapshot’s price factors are meaningful only as provider pricing intent:
- AWS
m7g/m7i = 0.810;m8g/m8i = 0.848. Graviton is 15–19% cheaper in list price, but application compatibility and useful performance decide value. - Alibaba Yitian
g8y.largeis¥192/month, versus Intelg8i.largeat¥251.16; current long-term discounts can still change the total ordering. - AWS
m8i.largeregional factor ranges from1.000in core US regions to1.250Singapore,1.292Tokyo, and1.594São Paulo. - Alibaba
g9i.largeis at factor1.000in Hangzhou/Shanghai/Beijing,0.900Ulanqab,1.770Singapore,1.798Tokyo, and1.929Hong Kong.
Region is not a coupon code. Data sovereignty, latency, service coverage, disaster-recovery topology, and cross-region traffic can dominate the instance factor.
Elasticity and commitment
Alibaba g9i.large PAYG at 730 hours costs ¥362.88, or 1.521× the
¥238.60 monthly price. The time-only crossing is:
For any commitment factor and realized utilization :
A five-year term and a purchased server both transfer demand risk to the customer. Compare unused commitment, generation lock, cash opportunity cost, residual value, failure replacement, and exit terms—not just the discount.
The owned-compute curve
The scenario uses a DHH-class 2U server with 192 vCPU, 384 GiB RAM, fleet-average
19.2 TB local NVMe, purchase price about ¥169,500, five-year life, and 70%
target fill. A spare is added from the second active server onward. Internal
labor, migration, application changes, and business risk are excluded.
| Stable business vCPU | Total servers | Cash material cost / vCPU-month |
|---|---|---|
| 16 | 1 | ¥220.36 |
| 32 | 1 | ¥110.18 |
| 64 | 1 | ¥55.09 |
| 128 | 1 | ¥27.54 |
| 192 | 3 | ¥55.09 |
| 512 | 5 | ¥40.15 |
| 1,000 | 9 | ¥31.63 |
| 4,000 | 32 | ¥27.56 |
| 64,000 | 501 | ¥22.89 |
The first server filling from 16 to 128 vCPU cuts unit cost eightfold. Expanding from 4,000 to 64,000 vCPU—16× more scale—cuts it only another 17%. Most scale economy arrives at the beginning; later results are driven by utilization and hardware life.
First and durable crossings
| Cloud comparison | Cloud CNY / vCPU-month | First below cloud | Durable below cloud |
|---|---|---|---|
AWS c7a on-demand |
¥254.07 |
14 vCPU |
14 vCPU |
AWS c7a 3-year Standard RI proxy |
¥100.32 |
36 vCPU |
36 vCPU |
Alibaba c8i PAYG |
¥148.81 |
24 vCPU |
24 vCPU |
Alibaba c8i 5-year public term |
¥29.35 |
121 vCPU |
2,972 vCPU |
“First” means one fill interval becomes cheaper. “Durable” means later server,
spare, rack, and network steps no longer push cost back above the cloud line.
The AWS RI row uses an m7i discount factor as a proxy for c7a, not a quoted
c7a RI offer.
Sensitivity: why the five-year comparison is fragile
| Change | AWS 3-year durable crossing | Alibaba 5-year durable crossing |
|---|---|---|
| Baseline | 36 vCPU |
2,972 vCPU |
| 50% target utilization | 106 vCPU |
no durable crossing below 200,000 vCPU |
| 85% target utilization | 36 vCPU |
984 vCPU |
| Hardware price -25% | 29 vCPU |
724 vCPU |
| Hardware price +25% | 43 vCPU |
12,634 vCPU |
| Three-year hardware life | 162 vCPU |
no durable crossing below 200,000 vCPU |
| Seven-year hardware life | 28 vCPU |
701 vCPU |
Against expensive on-demand compute, reasonable scenarios cross early. Against a deep five-year term near hardware amortization, utilization and asset life can change the answer by orders of magnitude.
Decision zones
| Stable workload | Baseline reading |
|---|---|
<16 vCPU |
On-demand cloud usually wins the fixed-cost problem |
16–64 vCPU |
Owned material cost can beat PAYG; short commitments may still win |
64–134 vCPU |
High-fill single-server sweet spot; still a single failure domain unless designed otherwise |
134–600 vCPU |
Expansion sawtooth matters; quote the actual server and spare plan |
600–3,000 vCPU |
Owned compute is durable versus 1–3 year terms; five-year outcome depends on fill |
3,000+ vCPU |
Under baseline life/fill, owned material cost is durably below all modeled offers |
Cloud remains strongest for unknown duration, high peak/mean ratio, global small footprints, interruptible work, and rapid release. Owned compute is strongest for stable, long-lived, standardized workloads with existing procurement and operations capability.
Historical context
AWS ~2C8G advertised-capacity price fell 73.5% from 2007 to 2026, but almost all list-price decline occurred before 2017. Alibaba 2C8G monthly price fell only 21.0% from 2016 to 2026 while PAYG fell 62.1%, largely by narrowing the elasticity premium. Mature FinOps therefore means benchmarking and migrating, not waiting for automatic cuts. See Cloud price history.
Data and sources
3 - Block storage: EBS and ESSD
Snapshot: 2026-08-22 · AWS us-east-1 · Alibaba Cloud cn-hangzhou ·
1 USD = 6.7817 CNY. Exact rates vary by region. The comparison aligns
provisioned capacity and requested IOPS/throughput, not latency or service level.
Direct answer
“Price per GB” is not a valid block-storage comparison by itself. It can rank gp3 as cheaper at baseline and then reverse the answer once performance is matched. A usable bill must price at least four things:
The final usable performance is also bounded by the instance:
Paying for IOPS that the attached instance cannot deliver creates cost without performance.
Two pricing philosophies
AWS EBS gp3: capacity and performance are explicit meters
The snapshot uses:
- Capacity:
$0.08/GB-month(¥0.5425). - Included:
3,000 IOPSand125 MiB/s. - Extra IOPS:
$0.005/IOPS-month. - Extra throughput:
$0.04/MiB/s-monthin the exactus-east-1snapshot.
So:
All three are provisioned meters. Actual low usage does not refund unused provisioned IOPS or throughput.
Alibaba ESSD: capacity often carries a performance curve
Traditional PL0–PL3 bind capacity to a product level. AutoPL separates capacity from optional provisioned and burst performance, but capacity still includes a rising baseline:
At 200 GiB this yields 11,800 IOPS and 220 MB/s; at 2,048 GiB the baseline reaches 50,000 IOPS and 350 MB/s. Alibaba’s documentation also notes that the attached instance can impose the lower I/O ceiling.
Capacity meter alone
| Product | Capacity price | Included/baseline performance | PAYG-equivalent | 1 year | 3 years | 5 years |
|---|---|---|---|---|---|---|
| EBS gp3 | ¥0.5425/GiB-month |
3K IOPS, 125 MiB/s | same list meter | contract-specific | contract-specific | contract-specific |
| ESSD PL0 | ¥0.50/GiB-month |
capacity-coupled | ¥0.7665 |
¥0.425 |
¥0.25 |
¥0.25 |
| ESSD PL1 / AutoPL | ¥1.00/GiB-month |
capacity-coupled to 50K / 350 | ¥1.533 |
¥0.85 |
¥0.50 |
¥0.50 |
| ESSD PL2 | ¥2.00/GiB-month |
higher level; minimum 461 GiB | ¥3.066 |
¥1.70 |
¥1.00 |
¥1.00 |
| ESSD PL3 | ¥4.00/GiB-month |
higher level; minimum 1,261 GiB | ¥6.132 |
¥3.40 |
¥2.00 |
¥2.00 |
At this layer, gp3 is near PL0 and about 54% of PL1/AutoPL. That statement is true but incomplete.
Performance-matched scenarios
| Capacity and target | EBS gp3 | ESSD AutoPL baseline | gp3 / AutoPL | Reading |
|---|---|---|---|---|
| 200 GiB · 3K IOPS · 125 MiB/s | ¥108.51/month |
¥200.00/month |
0.54× |
gp3 baseline is cheaper |
| 200 GiB · 11.8K IOPS · 220 MiB/s | ¥432.67/month |
¥200.00/month |
2.16× |
AutoPL capacity baseline is cheaper |
| 2,048 GiB · 50K IOPS · 350 MiB/s | ¥2,765.85/month |
¥2,048.00/month |
1.35× |
AutoPL remains cheaper at its baseline ceiling |
This is the core block-storage insight: the answer flips because one product charges extra performance separately while the other bundles a capacity-driven baseline. It does not prove equal latency, durability, burst behavior, or instance delivery.
The exact rows are in
block_storage_scenarios.csv.
What the price table still hides
Snapshots and recovery
EBS snapshots bill changed blocks in S3-backed storage; cross-region copy, archive retrieval, fast snapshot restore, time-bounded copy, and provisioned initialization can add separate meters. ESSD snapshots, backup products, and cross-region recovery have their own lifecycle and transfer costs. A recovery budget needs restore time and restore throughput, not just snapshot GB-month.
Topology and network
A single cloud disk is an availability-zone resource. Cross-AZ database or application topologies may duplicate volumes and add network charges. Managed database storage can price capacity, IOPS, and throughput at different markup factors from raw block storage.
Provisioned versus consumed
Both capacity and performance can be paid before they are used. Track:
- provisioned vs used GiB;
- provisioned vs observed P95/P99 IOPS;
- provisioned vs observed throughput;
- instance channel utilization;
- snapshot growth and orphan retention;
- commitment coverage and unused term value.
Extreme-performance layers
At the high end, capacity is no longer the dominant meter. AWS io2 prices
provisioned IOPS by volume-level tiers. Alibaba ESSD PL-X similarly separates
capacity and IOPS; an official example for 2,048 GiB and two million IOPS totals
¥152,048/month, of which ¥150,000 is performance. Low-end disks monetize
capacity; high-end disks monetize performance.
Historical insight
AWS gp2 to gp3 reduced capacity price only 20%, from $0.10 to $0.08/GB-month.
For a 200 GiB volume, however, included baseline IOPS rose from 600 to 3,000,
cutting price per baseline IOPS by 84%. Alibaba’s 2016 SSD and 2026 ESSD PL1
both anchor at ¥1/GB-month; performance, reliability, and product semantics
improved while the capacity meter stayed flat.
This is why “storage prices did not fall” and “storage price-performance improved sharply” can both be true. See Cloud price history.
A minimum bill worksheet
Before comparing disks, fill one row per volume:
| Field | Required value |
|---|---|
| Region / AZ | Exact deployment path |
| Provisioned and used capacity | GiB, both values |
| IOPS | baseline, provisioned, P95/P99 observed |
| Throughput | baseline, provisioned, P95/P99 observed |
| Latency requirement | P50/P99 and block size |
| Instance channel | max IOPS and throughput |
| Snapshot and restore | changed GB, retention, RTO, copy path |
| Topology | number of volumes, replicas, AZs |
| Term | PAYG, monthly, 1/3/5 year, residual commitment |
If any of these is missing, a capacity-price ratio is a lead, not a conclusion.
Boundaries
- GB and GiB are retained exactly as providers publish them.
- AutoPL baseline does not imply the attached instance can deliver it.
- This comparison does not equalize latency, durability, burst, or SLA.
- AWS rates are regional and tax-exclusive; Alibaba China-site rates are tax-inclusive.
- Prices may have changed after 2026-08-22; refresh before purchase.
Data and sources
4 - Object storage: S3, OSS, and owned topology
Snapshot: 2026-08-22 · AWS us-east-1 · Alibaba Cloud China mainland ·
1 USD = 6.7817 CNY. Capacity rates, request policy, free allowances, and
packages are time-sensitive. Self-hosted crossings exclude labor, software
licenses, migration, and business-loss risk.
Direct answer
Object-storage capacity is now cheap and surprisingly close across providers. The bill diverges elsewhere:
For self-hosting, the corresponding denominator is not raw disk TB:
That is why object-storage economics do not have one universal “cloud exit size.” The first question is the minimum reliable topology.
Current capacity rates
| Storage class | AWS us-east-1 |
CNY equivalent | Alibaba OSS LRS |
|---|---|---|---|
| Standard | $0.023/GB-month |
¥0.156 |
¥0.120 |
| Infrequent access | $0.0125 |
¥0.0848 |
¥0.080 |
| Glacier Instant / Archive | $0.004 |
¥0.0271 |
¥0.033 |
| Glacier Flexible / Cold Archive | $0.0036 |
¥0.0244 |
¥0.015 |
| Deep Archive / Deep Cold Archive | $0.00099 |
¥0.0067 |
¥0.0075 |
The rows are price-adjacent, not service-equivalent. Retrieval latency, availability, durability topology, restore workflow, and feature semantics differ.
The small-object tax
Cold tiers often bill a minimum object size:
| Service class | Minimum billable object | Minimum storage duration | Extra metadata |
|---|---|---|---|
| S3 Standard-IA / One Zone-IA | 128 KB |
30 days |
— |
| S3 Glacier Instant | 128 KB |
90 days |
— |
| S3 Glacier Flexible / Deep Archive | object bytes | 90 / 180 days |
40 KB/object |
| OSS IA / Archive / Cold / Deep Cold | 64 KB |
30 / 60 / 180 / 180 days |
product-specific |
A 1 KB object can therefore consume 128× or 64× its logical size on the bill; a 10 KB object consumes 12.8× or 6.4×. Before moving data to a colder tier, measure object-count distribution, average and percentile size, overwrite/delete rate, and retention—not just total TB.
Activity meters
Requests
Snapshot reference rates:
- S3 Standard PUT/COPY/POST/LIST:
$0.005 / 1,000 requests. - S3 Standard GET:
$0.0004 / 1,000 requests. - OSS Standard: first 5 million PUT and 20 million GET per region-month free,
then
¥0.01 / 10,000; IA/Archive PUT/GET commonly¥0.10 / 10,000. - OSS Deep Cold PUT:
¥3.50 / 10,000.
Request policy can change quickly, and console browsing itself can issue GET or LIST requests. High object count can matter even when capacity is small.
Retrieval and early deletion
Snapshot examples:
- S3 Standard-IA retrieval:
$0.01/GB; Glacier Instant:$0.03/GB. - OSS IA:
¥0.0325/GB; Archive:¥0.06/GB; Cold Archive standard retrieval:¥0.06/GB; Deep Cold standard:¥0.018/GB.
Deleting, overwriting, or transitioning before the minimum duration can charge the remaining term. An archive restore can also create a temporary hot copy that is billed while accessible.
Transfer: the exit and delivery meter
| Path | Snapshot price |
|---|---|
| AWS aggregate internet egress | first 100 GB free; next 10 TB $0.09/GB (¥0.610/GB) |
| AWS same-region cross-AZ | commonly $0.01/GB each direction |
| Alibaba ECS internet egress, Hangzhou | ¥0.80/GB |
| Alibaba OSS busy / off-peak internet egress | ¥0.50 / ¥0.25 per GB |
| Alibaba OSS to CDN origin | ¥0.15/GB |
The same download has a different price from ECS, OSS busy time, OSS off-peak, or CDN. Draw the full data path before pricing. For provider exit, also check documented waiver eligibility and operational lead time; a conditional waiver is not the same as a zero-rate default.
Packages and commitment risk
Alibaba OSS Standard LRS 100 GB illustrates the package ladder:
| Purchase | Total / equivalent | Relative to PAYG |
|---|---|---|
| PAYG capacity | ¥12/month |
100% |
| Monthly package | ¥11/month |
91.7% |
| Six-month package | ¥54.78 total |
about 76.1% monthly equivalent |
| One-year package | ¥99 total |
68.8% monthly equivalent |
Unused capacity expires; region, redundancy type, and meter mismatch can prevent deduction. A package lowers nominal unit price only when its scope and usage fit.
Self-hosting begins with topology
The released scenario uses 75% erasure-code efficiency, 80% maximum safe fill, 5% spare-drive inventory, 5% monthly data change, and one practical 1 Gbps port per 100 TB/month of remote replication.
| Topology | Minimum nodes / sites | What it can represent |
|---|---|---|
| Four-node lower bound | 4 / one site | Historical capacity floor; not a current full production baseline |
| Eight-node single site | 8 / one site | Current production host lower bound; node/disk failure domain |
| Eight-node dual site | 16 / two sites | Complete remote copy plus replication network |
| Eight-node three site | 24 / three sites | Conservative multi-failure-domain approximation |
| Backblaze-style Vault | 20 / 20 racks | 17+3 erasure coding across rack failure domains |
None is automatically equivalent to S3 Standard’s service level. Durability, availability, API semantics, operations, audit, and recovery must be tested separately.
Unit cost by topology
| Logical capacity | Eight-node single site | Dual site | Three site | 20-rack Vault |
|---|---|---|---|---|
| 100 TB | ¥0.1786/GB-month |
¥0.4822 |
¥0.7759 |
¥1.0005 |
| 200 TB | ¥0.0893 |
¥0.2411 |
¥0.3879 |
¥0.5002 |
| 500 TB | ¥0.0357 |
¥0.0964 |
¥0.1552 |
¥0.2001 |
| 1 PB | ¥0.0179 |
¥0.0482 |
¥0.0776 |
¥0.1001 |
| 2 PB | ¥0.0145 |
¥0.0346 |
¥0.0550 |
¥0.0500 |
| 5 PB | ¥0.0113 |
¥0.0301 |
¥0.0481 |
¥0.0254 |
| 10 PB | ¥0.0111 |
¥0.0280 |
¥0.0451 |
¥0.0181 |
At 100 TB the eight-node pool is mostly empty. Around 200 TB it approaches an OSS one-year package; at 1 PB its single-site capacity cost is about one fifth of that package. Adding sites changes the answer because hardware and replication network are duplicated.
First and durable capacity crossings
| Owned topology | AWS S3 Standard list | Alibaba OSS PAYG | Alibaba OSS one-year package |
|---|---|---|---|
| Four-node single-site lower bound | 55 TB |
71 TB |
95 TB |
| Eight-node single-site production baseline | 115 TB |
149 TB |
199 TB |
| Eight-node dual site | 310 TB |
402 TB |
536 TB |
| Eight-node three site, first / durable | 498 / 498 TB |
647 / 647 TB |
863 / 1,223 TB |
| 20-node / 20-rack Vault | 642 TB |
834 TB |
1,112 TB |
These are capacity plus replication-network material crossings. S3/OSS requests, retrieval, and small-object overhead are excluded on the cloud side; commercial software, support, load balancers, security, and internal labor are excluded on the owned side.
Sensitivity versus OSS one-year package
| Change | Eight-node single | Dual site | Three-site durable |
|---|---|---|---|
| Baseline | 199 TB |
536 TB |
1,223 TB |
| Hardware -25% | 169 TB |
476 TB |
1,047 TB |
| Hardware +25% | 229 TB |
597 TB |
1,399 TB |
| Safe fill 60% | 199 TB |
536 TB |
2,363 TB |
| Monthly change 20% | 199 TB |
1,047 TB |
7,665 TB |
| High facility price | 224 TB |
587 TB |
1,300 TB |
Single-site capacity is insensitive to write churn; multi-site storage is not. High-churn data can make network replication dominate and may belong in a database, block store, or shared filesystem instead.
Historical insight
S3 Standard fell from $0.15/GB-month in 2006 to $0.023 in 2016, then stayed
flat through the snapshot. Alibaba OSS Standard directory price reached
¥0.12 in 2018; a durable public effective rate of ¥0.09 appeared in 2024.
Capacity followed a hardware-like early decline, then became a platform meter.
Egress and activity did not follow the same curve. See Cloud price history.
Decision zones
| Workload | Baseline tendency |
|---|---|
<100–200 TB, uncertain growth |
Cloud object storage avoids the minimum pool |
~0.2 PB+, one-site capacity need |
Eight-node owned capacity enters the economic range |
~0.5 PB+, two-site copy |
Formal owned comparison becomes worthwhile |
~0.9–1.3 PB+, three-site / rack fault domains |
Reliable-topology owned economics can cross normal cloud capacity rates |
20–25 TB/month+ stable delivery |
Compare fixed transit/CDN path against per-GB egress separately |
| Global edge, DDoS, volatile demand | Keep CDN and elastic edge even if origin capacity is owned |
Cloud exit does not require rejecting CDN, edge, or managed security. A common efficient design owns stable origin capacity and continues buying statistically pooled distribution.
Boundaries
- Capacity crossings are not SLA or durability certifications.
- Four-node MinIO is retained only as a lower-bound reference.
- Commercial object software and internal operations are excluded from the baseline.
- DHH’s observed S3 contract uses billed footprint; primary logical data gives a different denominator.
- Request policy, packages, and prices can change after 2026-08-22.
Data and sources
5 - Egress and network paths
Snapshot: 2026-08-22. Network prices vary by region, path, direction, tier, and contract. A public transit port is not service-equivalent to cloud egress; the comparison exposes the different cost curves.
Direct answer
Network is its own bill, not an attachment to compute or storage. The same byte can be free on ingress, charged twice across an availability-zone round trip, processed by NAT, and charged again on internet egress.
Draw the path before applying a rate.
Current reference paths
| Provider / service | Path | Snapshot rate |
|---|---|---|
| AWS aggregate services | First internet egress allowance | 100 GB/month free outside China/GovCloud |
| AWS aggregate services | Next 10 TB internet egress | $0.09/GB (¥0.610/GB) |
| AWS EC2/RDS | Same-region cross-AZ | commonly $0.01/GB each direction |
| AWS NAT Gateway | Processing | $0.045/GB + $0.045/hour reference |
| AWS public IPv4 | Address | $0.005/hour |
| Alibaba ECS Hangzhou | Internet egress by traffic | ¥0.80/GB |
| Alibaba OSS | Busy / off-peak internet egress | ¥0.50 / ¥0.25 per GB |
| Alibaba OSS | CDN origin egress | ¥0.15/GB |
| Alibaba cross-AZ NAT | Processing CU | ¥0.23/GB-equivalent + ¥0.23/hour |
AWS aggregates egress tiers across many services and regions; eligibility and exceptions matter. Alibaba same-region VPC product communication is often free, but NAT, CEN, EIP, load balancers, cross-region links, and public paths introduce their own meters.
Fixed bandwidth versus per GB
The self-transit scenario uses a public 1 Gbps line at ¥12,500/month and a
conservative practical load of 100 TB/month—about 30% of theoretical line
rate. This is a procurement anchor, not a universal market price.
| Monthly egress | Required 1G ports | Port cost | Effective port ¥/GB | AWS $0.09 |
Alibaba ECS ¥0.8 |
Alibaba OSS busy ¥0.5 |
|---|---|---|---|---|---|---|
| 10 TB | 1 | ¥12,500 |
¥1.250 |
¥6,104 |
¥8,000 |
¥5,000 |
| 20 TB | 1 | ¥12,500 |
¥0.625 |
¥12,207 |
¥16,000 |
¥10,000 |
| 25 TB | 1 | ¥12,500 |
¥0.500 |
¥15,259 |
¥20,000 |
¥12,500 |
| 50 TB | 1 | ¥12,500 |
¥0.250 |
¥30,518 |
¥40,000 |
¥25,000 |
| 100 TB | 1 | ¥12,500 |
¥0.125 |
¥61,035 |
¥80,000 |
¥50,000 |
| 500 TB | 5 | ¥62,500 |
¥0.125 |
¥305,177 |
¥400,000 |
¥250,000 |
Break-even volume is:
| Comparison | Material crossing |
|---|---|
AWS $0.09/GB |
~20.5 TB/month |
Alibaba ECS ¥0.8/GB |
~15.6 TB/month |
Alibaba OSS busy ¥0.5/GB |
25 TB/month |
The cloud curve starts at zero and scales with bytes. The port curve starts with a fixed step and then has near-zero marginal bytes until the next port. Bursty, uncertain, global, or DDoS-exposed traffic may justify the cloud/CDN premium; stable bulk transfer crosses early.
Alibaba fixed public bandwidth
The public Hangzhou example prices 1 Mbps fixed bandwidth around ¥23/month
versus ¥0.8/GB by traffic. They cross at 23 / 0.8 = 28.75 GB/month.
One Mbps can theoretically deliver about 328.5 GB/month, so fixed bandwidth
becomes cheaper at roughly 8.8% utilization. Peak entitlement and service
quality remain different from a by-traffic peak cap.
Architecture consequences
- Use an S3 Gateway Endpoint instead of routing S3 traffic through AWS NAT when applicable.
- Avoid accidental cross-AZ round trips for chatty application/database paths.
- Price ECS, OSS busy/off-peak, and CDN-origin delivery as separate exits.
- Keep stable origin and backup capacity on fixed or private paths; keep global edge, CDN, DDoS, and volatile traffic on statistically pooled services.
- Track IPv4, idle NAT, orphan load balancers, and cross-region replication as first-class meters.
Exit capability
Provider exit waivers can materially change C1, but only when eligibility, covered services, destination, notice, transfer window, and approval process are documented. A negotiated or conditional waiver is recorded separately from the default meter. The operational export path and time limit remain part of the test even when the rate is zero.
Historical insight
AWS marginal egress fell from $0.20/GB in 2006 to $0.09 in 2014, then
remained flat through the snapshot. Alibaba ECS Hangzhou stayed at ¥0.8/GB
across the report’s 2016–2026 anchors. Silicon and disk gains do not automatically
flow into the network meter. See Cloud price history.
Boundaries
- Port procurement lacks the cloud platform’s global backbone, elasticity, routing, DDoS, operations, and zero-startup option.
- The 1 Gbps quote and 100 TB practical load are scenario inputs.
- Taxes, installation, private contracts, and regional fees can move crossings.
- All rates must be refreshed after the snapshot before procurement.
Data and sources
6 - Managed-service markup
Planned public model. PostgreSQL-compatible managed databases are the first calibration target.
Split price from value
The model first estimates equivalent resource cost, then itemizes operations the managed service supplies: provisioning, patching, backups, failover, monitoring, support, compliance, control plane, and service risk. The residual price is not automatically waste; it is the amount that must be justified by delivered value.
Questions the page must answer
- Which responsibilities actually move to the provider, and which remain shared?
- Which features are used, and what would they cost to reproduce at the required coverage?
- What restrictions, missing extensions, or control-plane dependencies reduce value?
- How do commitment, outage remedy, and exit cost change the apparent markup?
Seed essay: Is a cloud database an intelligence tax?. Current model outputs will replace its historical prices while keeping the original argument and period visible.
7 - Cloud price history
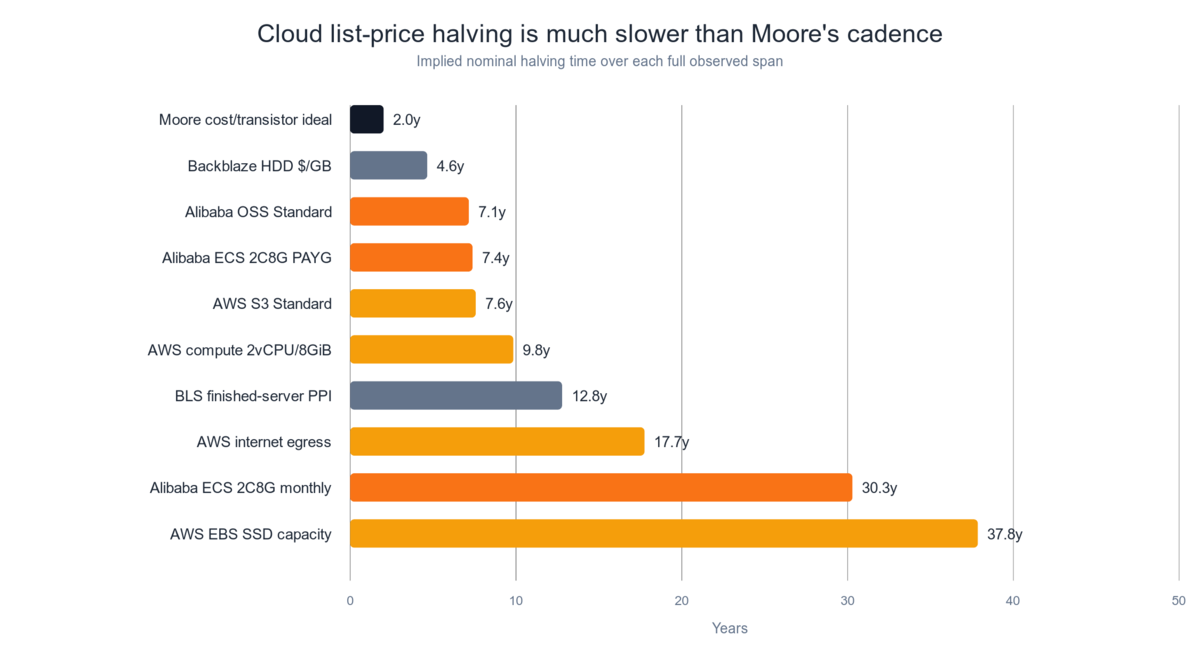
Observation windows differ by series. The common current endpoint is the 2026-08-22 snapshot. Implied half-life describes the observed interval; it is not a forecast.
Direct answer
Cloud prices fell substantially, but they did not follow a stable “halve every two years” path. Early competition produced large step changes; mature core meters often plateaued. Recent gains are more likely to require moving to a new instance generation, architecture, storage class, or commitment model than waiting for an old SKU to become cheaper automatically.
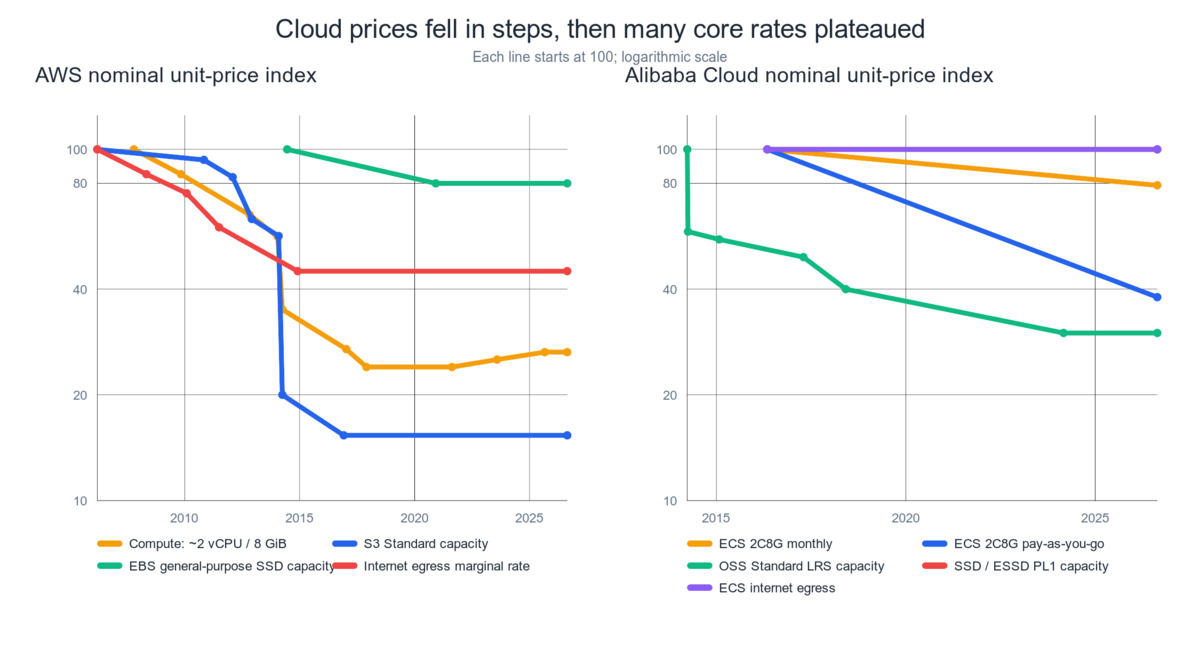
What actually halved—and how slowly
| Series | Observed span | Start → end | Nominal change | Implied half-life |
|---|---|---|---|---|
| AWS ~2 vCPU / 8 GiB compute | 2007–2026 | $0.400 → $0.10584/h |
-73.5% |
9.8 years |
| AWS S3 Standard capacity | 2006–2026 | $0.150 → $0.023/GB-month |
-84.7% |
7.6 years |
| AWS general-purpose SSD capacity | 2014–2026 | $0.100 → $0.080/GB-month |
-20.0% |
37.8 years |
| AWS internet-egress marginal rate | 2006–2026 | $0.200 → $0.090/GB |
-55.0% |
17.7 years |
| Alibaba ECS 2C8G monthly | 2016–2026 | ¥302 → ¥238.60/month |
-21.0% |
30.3 years |
| Alibaba ECS 2C8G PAYG | 2016–2026 | ¥1.31 → ¥0.4971/h |
-62.1% |
7.4 years |
| Alibaba OSS Standard public effective rate | 2014–2026 | ¥0.300 → ¥0.090/GB-month |
-70.0% |
7.1 years |
| Alibaba SSD / ESSD PL1 capacity | 2016–2026 | ¥1.00 → ¥1.00/GB-month |
0% |
none |
| Alibaba ECS internet egress | 2016–2026 | ¥0.80 → ¥0.80/GB |
0% |
none |
The values come from
long_run_metrics.csv.
Inflation-adjusted figures are published separately; they do not correct for
cross-generation performance.
Four different histories
Compute: price cuts became migration work
AWS same-advertised-capacity compute fell rapidly through 2017, then roughly
plateaued: m4.large was $0.108/h, m5.large and m6i.large $0.096,
m7i.large $0.1008, and m8i.large $0.10584. Price-performance improved,
but realizing it required moving generation and validating the workload.
Alibaba’s monthly and PAYG curves diverged. A 2C8G monthly shape fell only 21%
from 2016 to 2026, while PAYG fell 62.1%. Much of the latter was a narrowing of
the elasticity premium: a full PAYG month went from 3.17× monthly to 1.52×.
Object storage: closest to hardware—then a ten-year plateau
S3 Standard’s first tier fell from $0.15 in 2006 to $0.023 in 2016, then
stayed nominally flat through the snapshot. Alibaba OSS Standard moved from
¥0.30 in 2014 to a ¥0.12 directory rate; a durable public effective rate of
¥0.09 appeared in 2024. The large early fall did not remove request,
retrieval, minimum-duration, or egress meters.
Block storage: capacity plateau, performance-density gain
EBS gp2 to gp3 reduced capacity price only 20%. For a 200 GiB volume, however,
baseline IOPS rose from 600 to 3,000, so price per baseline IOPS fell 84%.
Alibaba’s 2016 SSD and 2026 ESSD PL1 both anchor at ¥1/GB-month; product
semantics and performance changed even though the capacity meter did not.
Egress: the least silicon-like meter
AWS first-paid-tier egress reached $0.09/GB in 2014 and then remained flat;
the 2021 free allowance improved small-account average cost but not large-volume
marginal cost. Alibaba ECS Hangzhou egress stayed at ¥0.8/GB across the
2016–2026 anchors. Path engineering—CDN, private connectivity, caching,
regional placement, or self-hosted transit—matters more than waiting.
Full bills move slower than headline compute
The capacity basket is approximately 2 vCPU / 8 GiB compute + 200 GB/GiB general block storage + 1 TiB monthly internet egress, plus current AWS public IPv4. It is a capacity comparison, not a performance or SLA comparison.
| Basket | Start | End | Change | Implied half-life |
|---|---|---|---|---|
| AWS 2008 → 2026 | $486.08/month |
$180.07/month |
-63.0% |
12.6 years |
| Alibaba monthly 2016 → 2026 | ¥1,321.20/month |
¥1,257.80/month |
-4.8% |
141.0 years |
| Alibaba PAYG 2016 → 2026 | ¥1,979.90/month |
¥1,488.68/month |
-24.8% |
24.3 years |
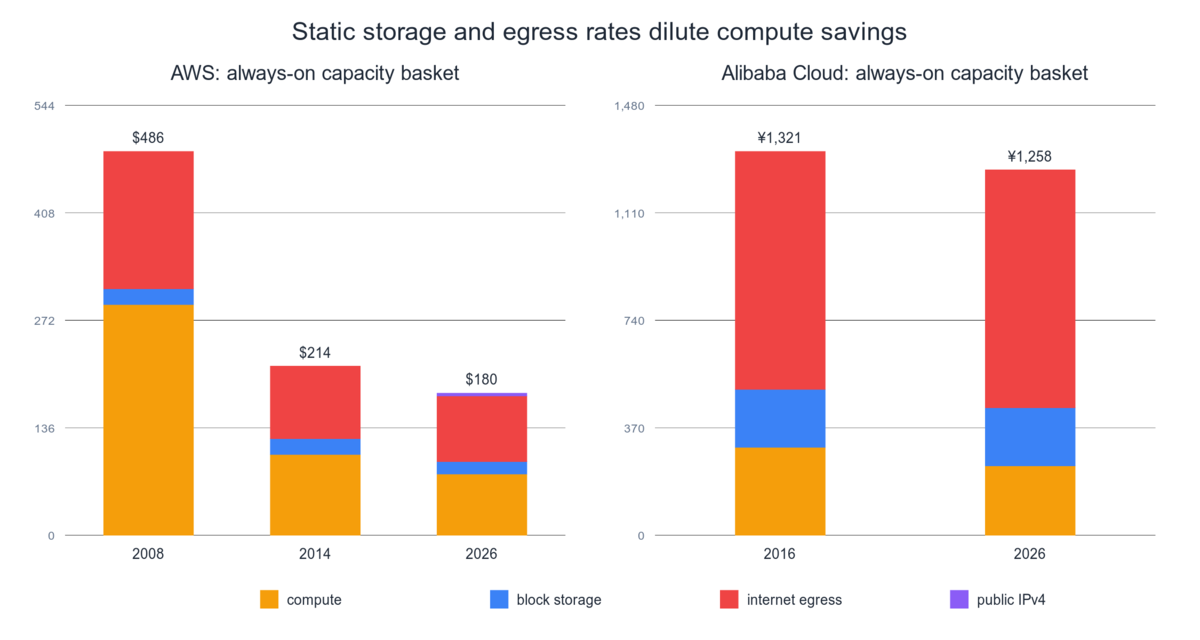
In the 2026 AWS basket, egress is 46.2% of the bill—larger than compute at 42.9%. In the Alibaba monthly basket, unchanged egress is 65.1%. A workload’s bill weights decide whether a new compute generation matters.
Budgeting and FinOps implications
- Do not budget automatic 10–20% annual list-price cuts for mature core SKUs.
- Benchmark new generations every two to three years; migrate first, commit second.
- Keep separate budgets for compute, storage capacity, storage performance, object activity, and network paths.
- Preserve public price as the contract anchor, but plan using invoice-level effective rates and commitment waste.
- Model high-egress workloads independently; their economics are not governed by the compute curve.
- For self-hosting, hardware also arrives in steps. New server purchases capture technology gains only at refresh time, while facilities, power, and network set a floor.
Boundaries
- Public price is not enterprise net price.
- Same-advertised-capacity generations are not performance-equivalent.
- S3, OSS, EBS, ESSD, and self-hosted systems differ in durability, latency, topology, and operations.
- Alibaba’s exact long-run compute series starts in 2016 because earlier full SKU tables could not be reconstructed reliably.
- The endpoint may change after 2026-08-22; refresh before purchase.
Data and sources
8 - Dataset releases
Every number highlighted in the ledger points to a dated release. A release is immutable: a correction creates a new version rather than overwriting the old bytes.
| Dataset | Coverage | Source window | Status |
|---|---|---|---|
Cloud build-versus-buy modelbuild-vs-buy-2026
|
Compute, PostgreSQL RDS-like services, object storage, egress, break-even points, and sensitivity. | 2026-08-22—2026-08-24 | released-snapshot |
AWS and Alibaba Cloud pricing modelcloud-pricing-2026
|
EC2/ECS, RDS, block storage, object storage, traffic, commitments, and time value. | 2026-08-22—2026-08-24 | released-snapshot |
Cloud price-history modelcloud-price-history-2026
|
Long-run compute, storage, and egress price anchors with physical-input and inflation context. | 2006—2026; reviewed 2026-08-24 | released-snapshot |
“Released snapshot” means the files ship with the site together with sources, methodology, schema, and checksums. It is still not a live provider quote.
Release contents
Each version contains:
Three complementary datasets
Cloud pricing · 2026-08-22-v1
Current-reference AWS and Alibaba Cloud tables for EC2/ECS, EBS/ESSD, S3/OSS, network, PostgreSQL RDS, commitments, and managed-database curves.
Build versus buy · 2026-08-24-v1
Discrete cost curves, first and durable crossings, and sensitivity tables for compute, PostgreSQL, object storage, and fixed-port egress. Baseline internal labor and migration cost are deliberately excluded.
Price history · 2026-08-24-v1
Long-run public-price anchors, nominal and real indexes, workload bill baskets, physical-input context, and historical source records from 2006–2026.
Status semantics
released-snapshot means the files ship with the site and pass checksum and
headline-value verification. It does not mean the price is current today,
that a provider supplied a formal quote, or that two services are fully
equivalent. Use the snapshot date and applicability note whenever quoting a
value.
The machine-readable release index is at /data/index.json.